What happens if I monitor my biological age over the long term while implementing longevity measures? Will I be able to distinguish a clear evolutionary trend, a sleek downward curve as I shed years over the months? Perhaps there will be plateaux or even setbacks, as is the case when I try to lose weight… Or will it be an extremely dynamic zigzag, losing a few years then gaining a couple – depending on my level of stress, environmental factors or other variables on which I have no conscious influence?
This is a particularly intriguing question since due to the relative novelty of epigenetic age testing, there are very few (if any) accounts of long-term measurements. As a rule, study participants will have their biological age tested before and/or after a specific intervention or an illness – thus providing a still image of a particular effect or correlation.
But today’s anecdotal test-person (n=1; M) is a committed biohacker, who has been surveying his epigenetic age over a period of 554 days and conducting tests at relatively regular intervals – ranging from a few days to a few weeks.
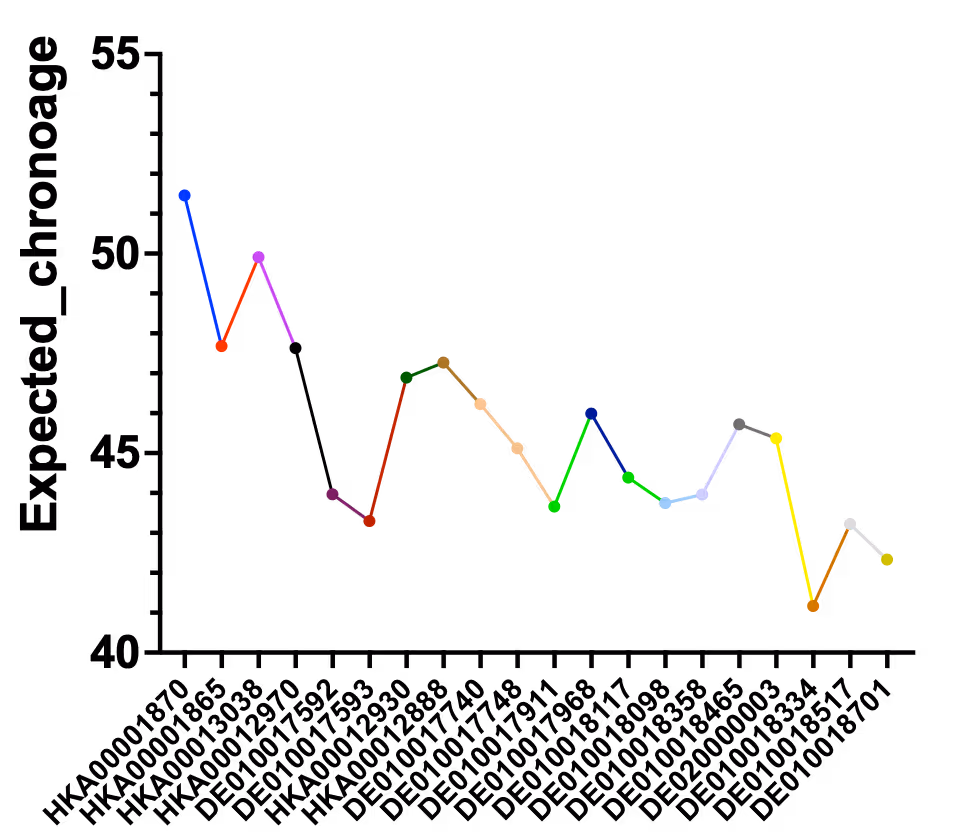
First impressions: there is definitely no sleek downward curve! But strikingly enough, even though the curve does zigzag a lot, the downward trend is also very obvious. Indeed, from the first to the most recent measurement, there is an impressive age reversal of over 10 years!
So, what interventions (or setbacks) could possibly explain the peaks and valleys on the way to rejuvenation?
Stay tuned to find out more about one man’s longevity journey!
+++
Illustrations
leeloo the first / pexels
epiAge Experience
 Back to all posts